Selenium WebDriver – Managing Selenium Grid Infrastructure using Arquillian Cube

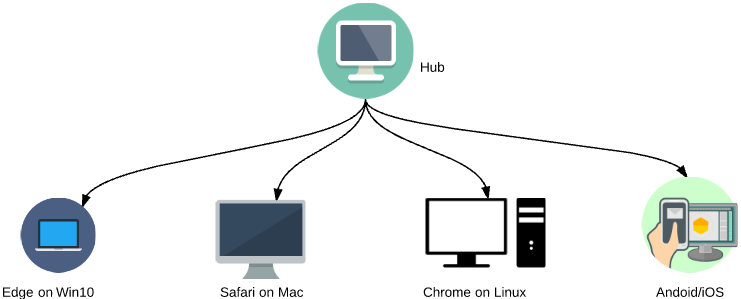
In the previous article, we saw how easily we could set up the selenium-grid infrastructure using docker. By using docker-compose file, we can setup the containers for the selenium grid. Then we can start our automated functional tests using the grid. Once the execution is done, we can issue a simple command to bring the entire selenium […]

Selenium WebDriver – How To Create A Disposable Selenium Grid Infrastructure using Docker

Selenium Grid – Overview: Selenium Grid is used to run our tests on different OS/browsers in parallel. It basically uses master-slaves (or hub-nodes) concept – where there is one master/hub and there are few slaves/nodes registered to the master/hub. When we send our tests to the master/hub for execution, based on the browser/OS requirements of

Selenium WebDriver – How To Create A Disposable Selenium Grid Infrastructure using DockerRead More »

JMeter – Installing Plugins Manager & Other Plugins through Command-line

In this short article, we will see how we could install the required plugins for JMeter 3.1 or above using Command-line / Ant. Goal: To install the required plugins for the JMeter test using Ant. Ant Target: Include below ant targets in your current project. [I assumed ‘jmeter.home’ property is set & pointing to JMeter

JMeter – Installing Plugins Manager & Other Plugins through Command-lineRead More »

JMeter – How To Share Performance Test Results in Slack

Overview: Test automation is not just automating the application. I would say even sharing the test results programmatically with the team is part of Test automation. So that , team does not depend on any individual to get the results. Team can also take further action based on the test results without any delay. In

JMeter – How To Share Performance Test Results in SlackRead More »

JMeter – Centralized Logging Solution in Distributed Testing using ElasticSearch + Beats + Kibana

I would like to show you the Centralized Logging Solution Architecture design for JMeter distributed performance testing in this article. Distributed Testing Challenges: In JMeter distributed testing we might face below challenges. TestAutomationGuru has already given the solutions for these challenges using Open Source tools/technologies. JMeter & other dependencies setup JMeter – Distributed Load Testing using Docker

JMeter – Centralized Logging Solution in Distributed Testing using ElasticSearch + Beats + KibanaRead More »

Best Practices – JMeter – Adding Performance Testing in CI / CD Pipeline

We already have seen Continuous Performance Testing process as part of these articles. JMeter – ANT – Jenkins Integration – Part 1 JMeter – ANT – Jenkins Integration – Part 2 JMeter – Maven – Jenkins Integration JMeter – Gradle – Jenkins – TBD In this article, I would like to show how I have set

Best Practices – JMeter – Adding Performance Testing in CI / CD PipelineRead More »

Best Practices – Building Robust Test Automation Framework

This article explains the best practices to be considered in building robust test automation framework. Test Automation – A Brief History: I still remember – It was sometime in 2004. I was thrilled when I first saw QTP (now it is UFT) playing the recorded script – launching a browser, entering test data and submitting

Best Practices – Building Robust Test Automation FrameworkRead More »

JMeter – Distributed Load Testing using Docker + RancherOS in Cloud

Setting up the JMeter distributed test infrastructure for the performance testing is not very easy! We already have seen that Docker can help us here in setting up the infrastructure. If you have not read the articles of TestAutomationGuru, I would suggest you to check these. Distributed Load Testing using Docker Distributed Load Testing using

JMeter – Distributed Load Testing using Docker + RancherOS in CloudRead More »

JMeter – Real Time Results – InfluxDB & Grafana – Part 2 – Adding Custom Fields

I already have been using InfluxDB + Grafana for real time results of my JMeter test. You can find more details on the basic setup here.   In this article, Lets see how we can add some custom fields into the InfluxDB measurements for faster search which we might need in future. Problem Statement: In

JMeter – Real Time Results – InfluxDB & Grafana – Part 2 – Adding Custom FieldsRead More »

JMX Monitoring using Collectd + InfluxDB + Grafana

We have already seen monitoring CPU / Memory utilization using Collectd (this article). But It does not give all the information to identify the bottleneck of a Performance issue. In this article, we will be using Collectd Java plugin to monitor and manage Java Virtual Machine (JVM) using its JMX technology. Goal: To monitor and manage the

JMX Monitoring using Collectd + InfluxDB + GrafanaRead More »