Selenium WebDriver – Real Time Test Metrics Using Grafana & InfluxDB

Overview: Running automated regression on a daily basis as part of daily build is inevitable nowadays! It is cool to find & report the issues as soon as they are introduced. But it is very painful to maintain hundreds of automated tests & remote parallel execution! Once you have a huge automated regression test suite in place, […]

JMeter – How To Add Grafana Real Time Results In Jenkins Build Description

Overview: Testautomationguru already has released few detailed articles on creating real time results during Performance Testing. If you have not read them before, I would suggest you to check them out first. JMeter Real Time Results – Basic Setup JMeter Real Time Results – Advanced Setup for multiple projects JMeter – Server Performance Monitoring JMeter

JMeter – How To Add Grafana Real Time Results In Jenkins Build DescriptionRead More »

JMeter – Real Time Results – InfluxDB & Grafana – Part 2 – Adding Custom Fields

I already have been using InfluxDB + Grafana for real time results of my JMeter test. You can find more details on the basic setup here.   In this article, Lets see how we can add some custom fields into the InfluxDB measurements for faster search which we might need in future. Problem Statement: In

JMeter – Real Time Results – InfluxDB & Grafana – Part 2 – Adding Custom FieldsRead More »

JMX Monitoring using Collectd + InfluxDB + Grafana

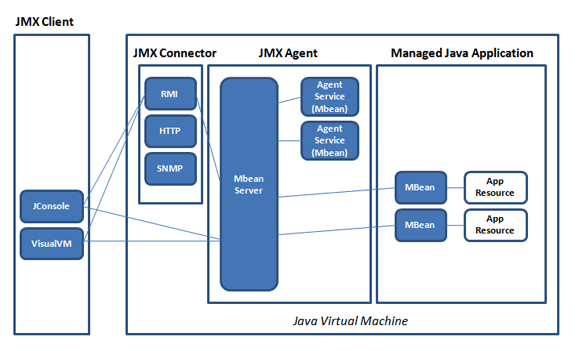
We have already seen monitoring CPU / Memory utilization using Collectd (this article). But It does not give all the information to identify the bottleneck of a Performance issue. In this article, we will be using Collectd Java plugin to monitor and manage Java Virtual Machine (JVM) using its JMX technology. Goal: To monitor and manage the

JMX Monitoring using Collectd + InfluxDB + GrafanaRead More »

JMeter – Server Performance Monitoring with Collectd + InfluxDB + Grafana

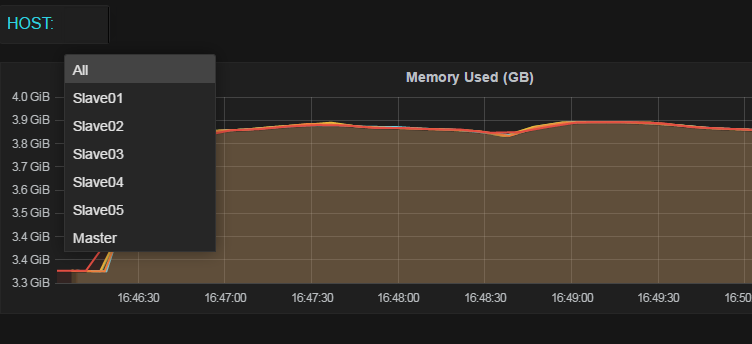
We already have seen in this article on monitoring server performance using JMeter plugin.  Even though the JMeter Server agent is useful to collect the server performance metrics, we need to use JMeter’s metrics collector to listen to the server agent to collect the data which was a little bit annoying. I was looking for some

JMeter – Server Performance Monitoring with Collectd + InfluxDB + GrafanaRead More »