
I would like to show you the Centralized Logging Solution Architecture design for JMeter distributed performance testing in this article.
Distributed Testing Challenges:
In JMeter distributed testing we might face below challenges. TestAutomationGuru has already given the solutions for these challenges using Open Source tools/technologies.
- JMeter & other dependencies setup
- JMeter – Distributed Load Testing using Docker + RancherOS in Cloud
- JMeter – Scaling out load servers using Docker Compose in distributed load testing
- REAL TIME: Performance test results monitoring
- JMeter – Real Time Results – InfluxDB & Grafana – Part 1 – Basic Setup
- JMeter – Real Time Results – InfluxDB & Grafana – Part 2 – Adding Custom Fields
- REAL TIME: Resource Monitoring
- JMeter – Server Performance Monitoring with Collectd + InfluxDB + Grafana
- JMX Monitoring using Collectd + InfluxDB + Grafana
- REAL TIME: Log Monitoring
- We will this in this article.
Real Time Response Data Monitoring:
When we do a load test using JMeter in Non-Gui mode, we could collect the real time performance test result metrics & application server metrics as shown below, with the help of InfluxDB + Grafana. Even though Grafana dashboard can show the number of requests passed vs failed etc, we might want to know why it failed.
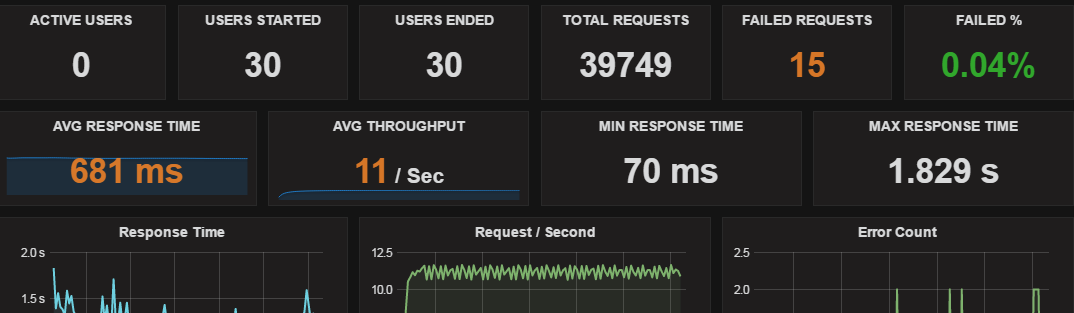
All the failed requests might not be due to HTTP Response code 500. Sometimes, the HTTP Response codes for the failed requests can still be 200. For example, Response Data Assertion simply checks if the given string is present in the Response Data or not. If it is not present, It fails the request which is fine. But what the response data we actually got during that time? It could be very important to know that to debug the application behavior during the performance test.
We often use Cloud / Remote machines to run the performance tests. Even if we log the response data in a log file, we might not be able to get the data immediately. We might want to wait for the performance test to complete to access the machine to check the logs. We can not collect these huge String in the InfluxDB as we did for the performance test result metrics as it is basically not designed for that purpose.
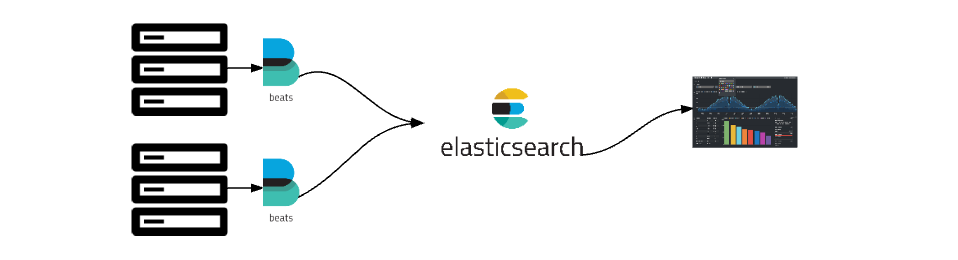
One of the neat solutions is to analyze, the application response data for failed requests, using ElasticSearch + File Beats + Kibana.
Infrastructure Setup:
- Download & Setup ElasticSearch
- Ensure that you are able to access elastic search using http://ip-of-elasticsearch-host:9200
- Download & Setup File Kibana
- Update config/kibana.yml with the elastic url to fetch the data
- Run kibana.bat / .sh
- Ensure that you are able to access kibana using http://ip-of-kibana-host:5601
- Download & Setup File Beats
- We need to have one file beat setup for each load generator.
- File Beat is responsible for collecting the log info and send it to elastic search engine.
- Update filebeat.yml file as shown below
- Paths : file path where we have the jmeter.log
- A Sample jmeter.log file format
2016/12/13 08:16:06 INFO - jmeter.threads.JMeterThread: Stopping: Thread Group 1-5

2016/12/13 08:16:06 INFO - jmeter.threads.JMeterThread: Stopping: Thread Group 1-1

2016/12/13 08:16:06 ERROR - kg.apc.jmeter.timers.VariableThroughputTimer: Waiting thread was interrupted java.lang.InterruptedException

at java.lang.Object.wait(Native Method)

at kg.apc.jmeter.timers.VariableThroughputTimer.delay(VariableThroughputTimer.java:78)

at org.apache.jmeter.threads.JMeterThread.delay(JMeterThread.java:771)

at org.apache.jmeter.threads.JMeterThread.process_sampler(JMeterThread.java:424)

at org.apache.jmeter.threads.JMeterThread.run(JMeterThread.java:261)

at java.lang.Thread.run(Unknown Source)
- By default, File Beat logs each line in the log file as a separate log entry. Sometimes exceptions might span multi lines. So we need to update filebeat.yml with the multiline pattern.
- For jmeter.log – each log entry has its time stamp. so, we can configure the pattern as
multiline.pattern: ^[0-9]{4}/[0-9]{2}/[0-9]{2}(starting with time stamp)
- When there is no time stamp, FileBeat can append the line to the previous line based on the configuration.
That is it! Restart filebeat.exe.
FileBeat will start monitoring the log file – whenever the log file is updated, data will be sent to ElasticSearch. Using Kibana we can monitor the log entries in ElasticSearch.
JMeter Test:
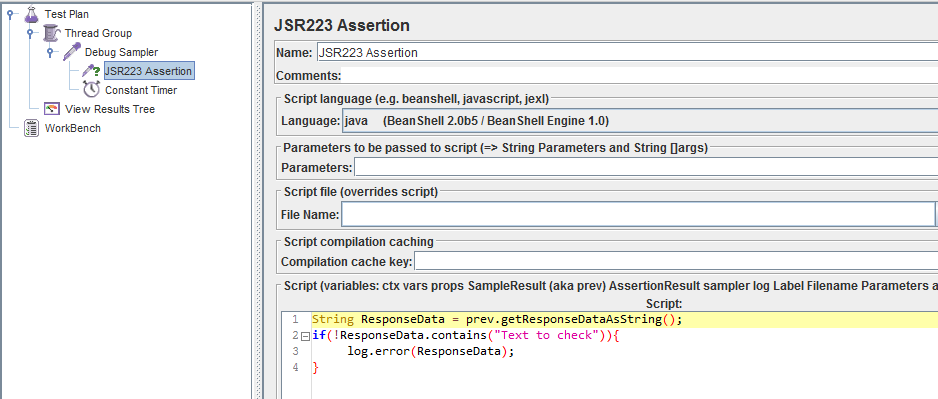
I create a very simple test as shown below. I have only Debug Sampler. Instead of using Response Assertion, I use JSR223 Assertion – to write more information in the log file in case of any error.
Lets run the test.
The test keeps writing below information in the log file.
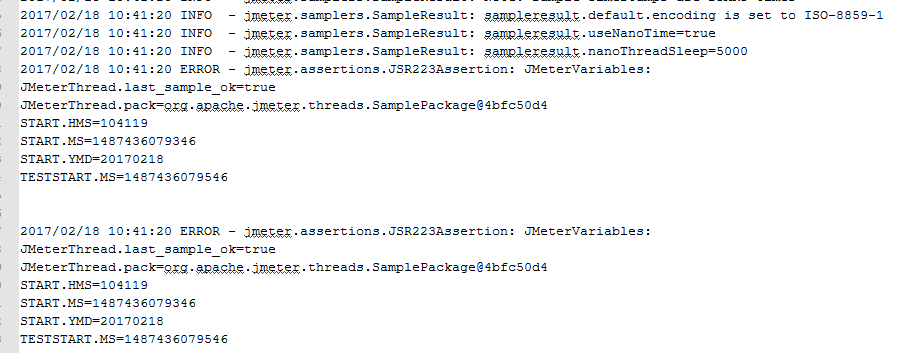
At this point, FileBeat will start collecting the information from the log file and forward to ElasticSearch which we can see through Kibana.
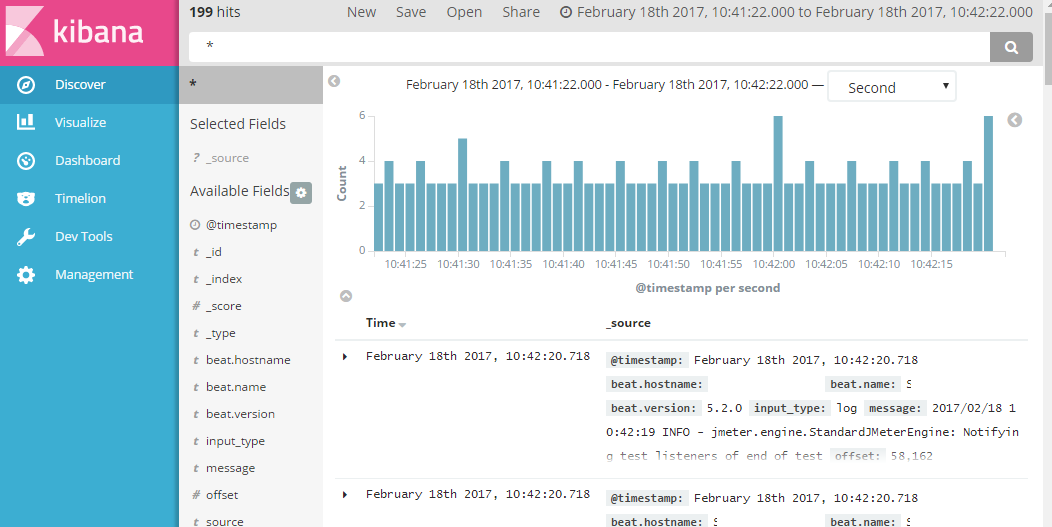
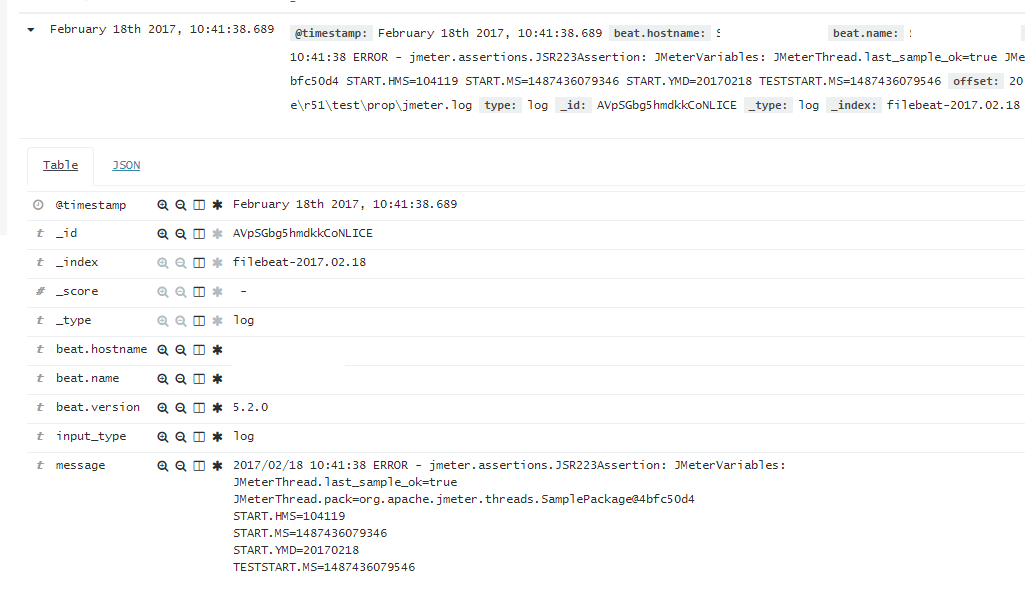
If we click on the small arrow to expand the details, message section below will show the actual data we are interested in.
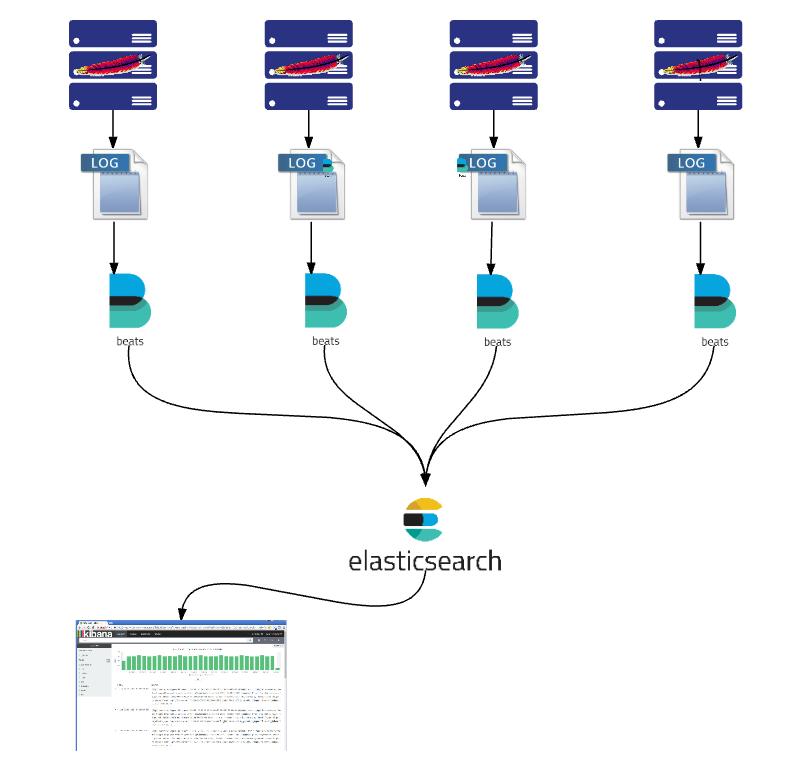
Centralized Logging Solution Architecture:
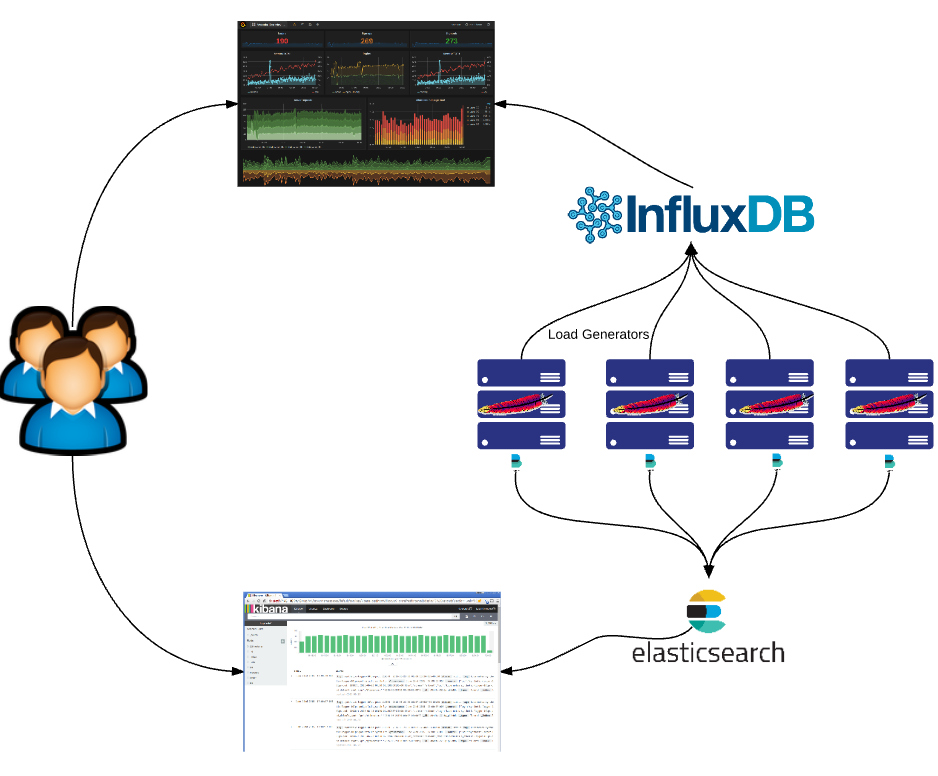
Summary:
Along with Real-Time performance test results, we are also able to collect the HTTP response data for the failed requests real time. The above setup is extremely helpful when we do a long-running distributed load testing in the cloud. When the requests suddenly started failing, This setup helps us to check the HTTP response data to understand the application and test behavior.
Happy Testing & Subscribe 🙂
First of all thanks for wonderful post. I did exactly what was mentioned above. After launching Kibana i am getting “Configure an index pattern”. I checked kibana.yml and enable kibana.index: “.kibana”. But still did not get dashboard. Kindly let me know if i missed out any steps.
Ok i added Index name or pattern as “*” and now i can get data from Logfile. however i am not able to get the dashboard. I will explore this more. thanks once again for the post.
Thanks for this wonderful article and to filter the load messages
Hi,
Can we have elasticsearch read the jmeter results file (.jtl) in csv format as well along with the log file so that we have one location for all our report needs? Elasticsearch can handle time series data and kibana has a component called Timelion which can be create visualisers. What are your views on that?
Yes, we can do that. I have been using InfluxDB + Grafana for this approach http://www.testautomationguru.com/jmeter-real-time-results-influxdb-grafana/
Sometimes, where we write this data could cause issues for an extremely high throughput application. InfluxDB can handle 100K records / sec. I am not sure of ElasticSearch. We need to measure it.
How would you handle log rotation in this scenario for each of your jmeter servers for the logs that beat is listening to. It doesn’t seem like jmeter has this feature natively.
Each JMeter server should have their own beats – assuming they are all running in their own hosts. Since its version 3.2, jmeter uses log4j which supports log rotation.
ah ok, how exactly is the log rotation for log4j configured within jmeter, i’m a little unfamiliar with how the log rotation is setup within jmeter