

Overview:
In TestAutomationGuru, we have seen many advanced JMeter/Performance Test result related articles. However I keep getting basic questions from readers that they would like to know how to understand aggregate report & summary report. This article is for beginners who try to understand the basic terminologies.
Sample Aggregate Report:

Label:
- Label is the name of the sampler. If you use Transaction Controller with ‘Generate Parent Sample’ option selected, then that could appear as the sampler.
- It is used to Group by the name and produce aggregate information accordingly.
- If you do not want to group all the ‘Order Product’ requests, instead you need to group by Product name, lets say ‘Order Product A’, ‘Order Product B’ etc, then update your JMeter test plan sampler name to ‘Order Product ${variable}’ – here ${variable} contains the product name.
# Samples:
- Total number of requests sent to the server during the duration of the test.
- In the above example, We sent 10 Login Request, 10 Order Products and so on.
Min & Max:
- In the above example, We had sent 10 login requests. Each request would have taken different time as shown here.
- Here the time starts from the moment JMeter send the request to the server & it includes
- Any time spent in the network back and forth
- Time server took to process the request
- Till the moment JMeter gets the complete response for the request.
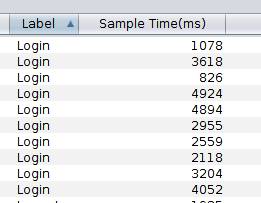
- Among all the samples time, show the minimum time taken. In the above example, it is 826 for Login
- Among all the samples time, show the maximum time taken. In the above example, it is 4924 for Login
Average (Mean):
- In the real project with huge test plan you would be having hundreds of samplers, thousands of requests would have been sent in your test execution. So we do not worry about individual sample time. Instead we use aggregate information like average, min, max, median etc. Average is sum of all the sample time divided by total number of requests.
- Average is also called as Mean
Flaw Of Average:
I have seen many people using Average response time as Key Performance Indicator. Some do not understand the difference between average and median. Average has a flaw. It flattens all the ups and downs and gives a straight line and wrong idea about the problem. The below classic example shows flaw of average.

When you have thousands of samples & if the average response time is 3 seconds, then you would have many samples which has the response time above 3 seconds. So, this is where we use percentiles like median, 90th percentile etc.
Lets consider this example. Lets assume that we sent 10 Login request. For the first 5 times, it took just 1 second to process the request. 6th time – due to some reason – it took 91 seconds. Again for the remaining 4 times, it took 1 sec each to process the request. Now we know that min is 1 second, max is 91 second. Average is (1+1+1+… + 91)/10 = 10 seconds
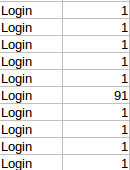
It creates an impression that the site’s response time is usually 10 seconds which is not true. The site is actually responds very well within 1 second most of the time. Just because of 1 outlier – which is 91 seconds – we came to a conclusion that the site’s usual response time is 10 seconds.
Median:
Median is another name for 50th Percentile or 50 percent line.
We understood that Average has a flaw! We want to eliminate those outliers in our results. This is where percentiles are very useful. Percentile calculation is very easy. Basically sort the values by time as shown here.
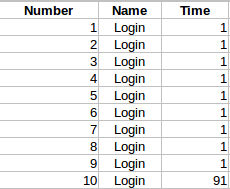
For median, take the middle value.
For Example: You have 7 samples. middle is 4. So you could use 4th sample value as median. It basically says 50% of percent of requests were taking less than or equal to ‘this’ time. Here ‘this’ is median.
If there are even numbers, in our above example we have 10 samples. What is middle here? In this case, we take 5th and 6th value and average it!
What??!……. Did we not just say average has a flaw??
Well… thats true. But we assume that all those outliers might not be present in the middle after sorting.
So in our case above the median is 1 second which says 50 % of the requests were taking less than or equal to 1 second which is right compared to average 10 seconds.
90% Line:
Median is good. Most of time you can not just worry about 50 % of the users. In the below example, median is 1 second which sounds great. So 50% of the users are happy!
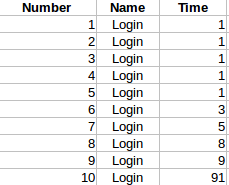
What about the remaining 50% of the users of our site? Whats their experience? Unfortunately we can not use average as well. This is where we use other percentile values like 90% line, 95% line 99% line etc.
The concept is same. As you take the middle for median, you take 90% value which indicates 90% of the request’s response times were smaller than ‘this’ value. In the above example, after sorting, as you have only 10 samples, use the 9th data point as 90% line. It shows that 90% of the requests were taking less than or equal to 9 seconds.
Similarly if you have more data points, you could pick 95% line, 99% line etc to ignore outliers.
Throughput:
Throughput is simply number of requests processed by the server per unit time. Do note that it is a client side metric. For ex: I send 5 login request with 12 seconds of think time between each request in a minute. So JMeter might show the throughput as 5 requests/minute. It does not mean the server could process only 5 requests / minute. It is because of the think time we have added between requests. If you need to calculate the actual server throughput, you need to bombard the server with requests gradually without think time.
Memory Consumption:
Do note that total, min, max, average do not consume a lot of memory. You just need to compare 2 values to find minimum or maximum, add 2 values to calculate total. On the other hand for percentile, JMeter has to keep all the requests response times in memory to calculate the percentile values. only if you know all the 10 sample values, you could pick 9th value as 90% line. In case of millions of samples, JMeter has to store them in a list and calculate the percentile accordingly.
Summary Report:
Summary Report is Aggregate report without percentile values. So it consumes less memory. If you are not interested in Percentile values, consider using Summary Report.
Summary:
Hope you have better understanding of Aggregate & Summary reports now. You should NEVER include any listener in your test plan during the actual test. You could include them only for debugging purposes. During the actual test, remove all listeners. Run the test without any listener and add command line option to write result in csv format. Later you could import this file in any listener you want.
jmeter -n -t testplan.jmx -l result.jtl
Happy Testing & Subscribe 🙂
Hi Vlns,
I have a query which i came across today lately, – Are the 90,95,99 or any percentiles are calculated for passed requests/transcation or the percentiles are not based on passed or failed, it calcs based on the total values captured during the test for any transcation.
For ex: I have written output using simple data writer, and there are few requests that are failed. when i used percentile fn. excel, i am getting one value for total values of a transcation, where as jmeter is calc only for passed transcations. So i believe jmeter will calc the %les only for passed transcations ?
Please let me know you comments.
It is calculated at run time for all – total, passed, failed – depends on the settings.
I am genuinely delighted to read this blog posts which consists of plenty of useful information, thanks for providing these kinds of statistics.