
This post is to troubleshoot the issues you are facing with InfluxDB while writing data using the methods mentioned in the below posts,
Please make sure all the below steps working fine in the order.
- InfluxDB should be up and running fine w/o any exception (in the console output).
- If this step itself fails, Please raise your question in StackOverFlow
- You should be able to access the admin interface of InfluxDB with this URL – http://[ipaddress]:8083
- Try to access this in the machine where JMeter is going to run.
- If this step fails, see if the port has been used already. or change that in InfluxDB config file.
[admin]
   enabled = true
   bind-address = ":8083"
   https-enabled = false
   https-certificate = "/etc/ssl/influxdb.pem"
- If you are not sure where to find the config file for InfluxDB, running the command ‘influxd config‘ which will show the default config values. Copy them and create a new .conf config file yourself.
- If you are using new conf file, restart InfluxDB with this command – influxd -config /etc/influxdb/influxdb.conf
This is very important as InfluxDB is a time-series DB. By default, it will show only the records where timestamp of the records < system timestamp.
- Add POSTMAN
- Update the URL as shown here – http://[ipaddress]:8086/write?db=[database]
Ex: http://10.11.12.13:8086/write?db=demo Note the port – it should be 8086 for writing the data. 8083 is for admin interface. 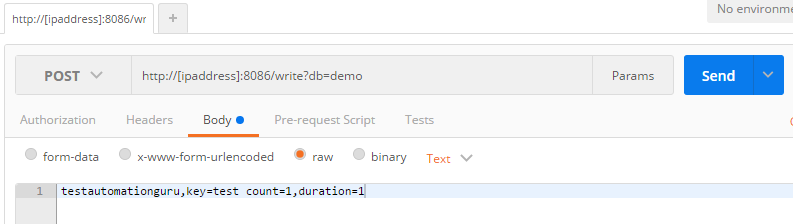
- Lets try to send this record through postman testautomationguru,key=test count=1,duration=1
- testautomationguru – is the name of table/measurement which will be created at run time by InfluxDB if it is not present already.
- key – it is a tag for faster query
- count and duration – some fields with values
- HTTP Method should be POST
- Place the data under Body –> Raw section
- Click on ‘Send’
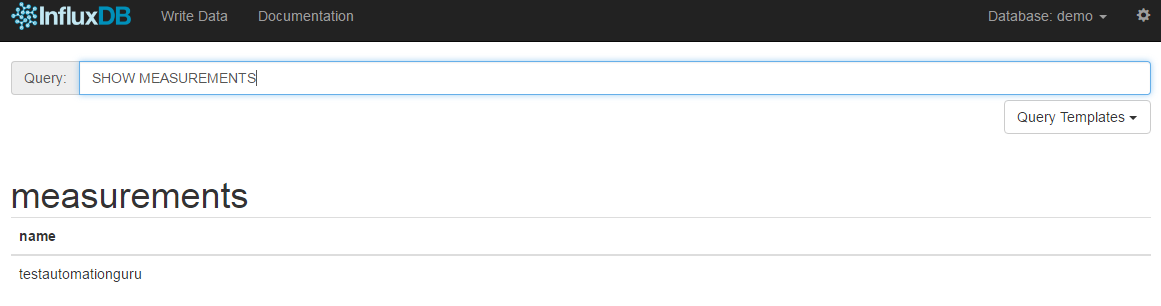
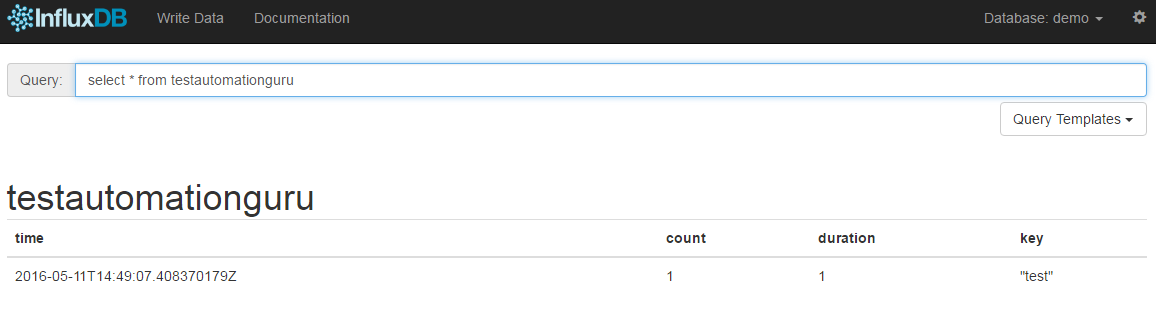
- You should be able to see the testautomationguru measurement & querying the measurement should show the series.
- Now run JMeter in non – gui mode. You should be seeing the measurements and data for the given DB.
- If it still does not work, Please check the JMeter.log and InfluxDB console for any Errors.
- For ex: My JMeter.log shows this info. Copy the text and try to place it in postman and try to post as you did above. There is a chance that some characters not escaped properly. yuo will know that in the HTTP response of the PostMan or share the log details with me.

When i tried to post data http://localhost:8086/write?db=jmeter, I am getting {“error”:”invalid character ‘e’ in literal true (expecting ‘r’)”} , Could you pls help me
Will you be able to share the log please?
How did you solved it ? Same problem here.
influxdb is not writing when there null values availble.
i.e.
jmeter.visualizers.JSR223Listener: Result : samples,label=Login,status=Success ,Responsecode = 200, null=null 1479735167833000000
How can I replace the null values while writing to influxdb.
Howcome is the field name itself null?
Trying to capture some values from database when the row is empty that time the filed name is coming as null.
If the value is null, we can replace it with empty string or some value like ‘N/A’. but the field/tag name itself cannot be null. You need to handle this.
Thank you. Yes, handled the null fields and values. But I was wondering why null values are not accepted by influxdb and also one comma or space is making the difference while posting the values.
Check here for escaping the special characters. https://docs.influxdata.com/influxdb/v1.1/write_protocols/line_protocol_reference/
I am using influx 0.9 and i have used the above jar in jmeter 3.3 version, and dont see any metrics pushed to influx, i have used the simillar command with jmeter 3.0 and it is working fine,
is there nay pre-req that influx version should be higher than 0.9?
Use latest version of influx.
i have tried it with latest version of influx (1.4), still the same behaviour, 3.0 is working fine and 3.3 is still not feeding data
Please ignore this, i can see jmeter populating the data in influx, had to create the influx database manually to populate measurements from jmeter 3.3
@vlns,
metrics not feeding when i use remote host (distributed load) the below command
jmeter -n -t script.jmx -R server1 ,
can you please clarify , it is bit urgent
i can see the test is getting excuted on the remote host, but the metrics is not feeding
@vlns,
When i use the remote host option, it is feeding only the report once the test is completed(consolidated report) and not during the real time , is this a expected behavior
You should be able to get real time results even in the remote mode.
Below command is running fine and feeding data to influx as it is running local
/opt/apache-jmeter-3.3/bin/jmeter -n -t testscript.jmx -Jjmeter.save.saveservice.output_format=xml -l results.xml -q local.properties
but when i use the below command to run on remote host, script is running but not feeding data to influxdb
/opt/apache-jmeter-3.3/bin/jmeter -n -t getUser4.jmx -Jjmeter.save.saveservice.output_format=xml -l results.xml -R 10.20.30.30 -q local.properties
i have also tried with -G instead of -q for globalproperties
Request to clarify on this as i am currently blocked due to this, i am using the same ApacheJMeter_core.jar on master and remote host
@vlns, any update on above query, please guide me if am doing anything wrong, i am currently blocked because of this
@vlns, Request you please help me in resolving this issue
@vlns Current API-core jar is not feeding PCT 90, 95, 99 values , Can you please add these to the metrics?